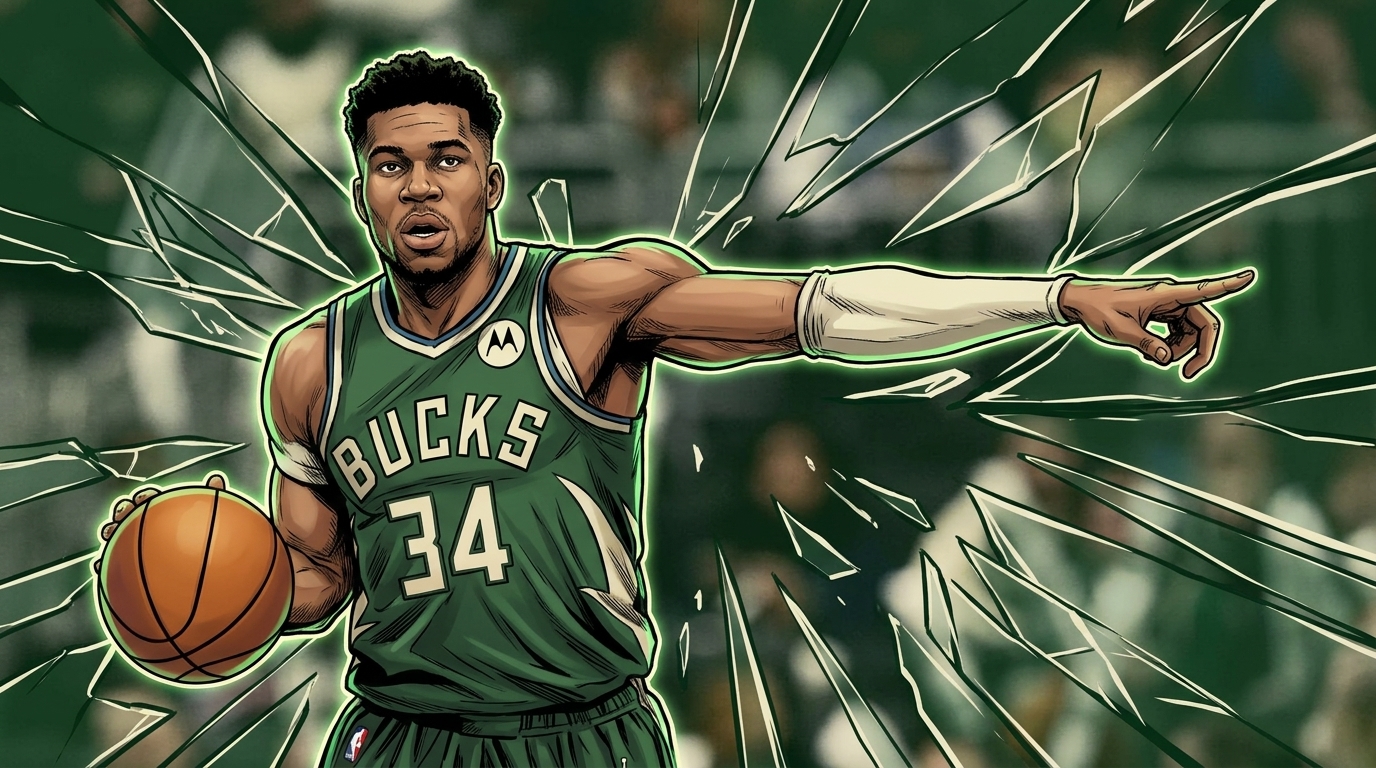
Victor Wembanyama posted 27.5 points and 10.5 rebounds per game across the first two NBA Finals games. His team lost both. That sentence is the entire problem the Spurs face heading into Game 3, and it is not a problem that yields to willpower or acceptance or anything Wembanyama said about “the journey” in his postgame remarks. It yields to a specific kind of pressure the Knicks are applying, one that has a name, a mechanism, and a historical track record that is very hard to argue with.
I want to put a framework around what New York is doing to San Antonio. Call it the Ceiling Compression Test: the question is not whether a historically great young player can produce. It is whether the ceiling of his production is high enough to overcome the floor the opposing defense has set for everyone else on his team. The Spurs are losing this test in consecutive games, and the margin in Game 2 (a single free throw with 9.5 seconds left) should not distract from how comprehensively the Knicks are passing it.
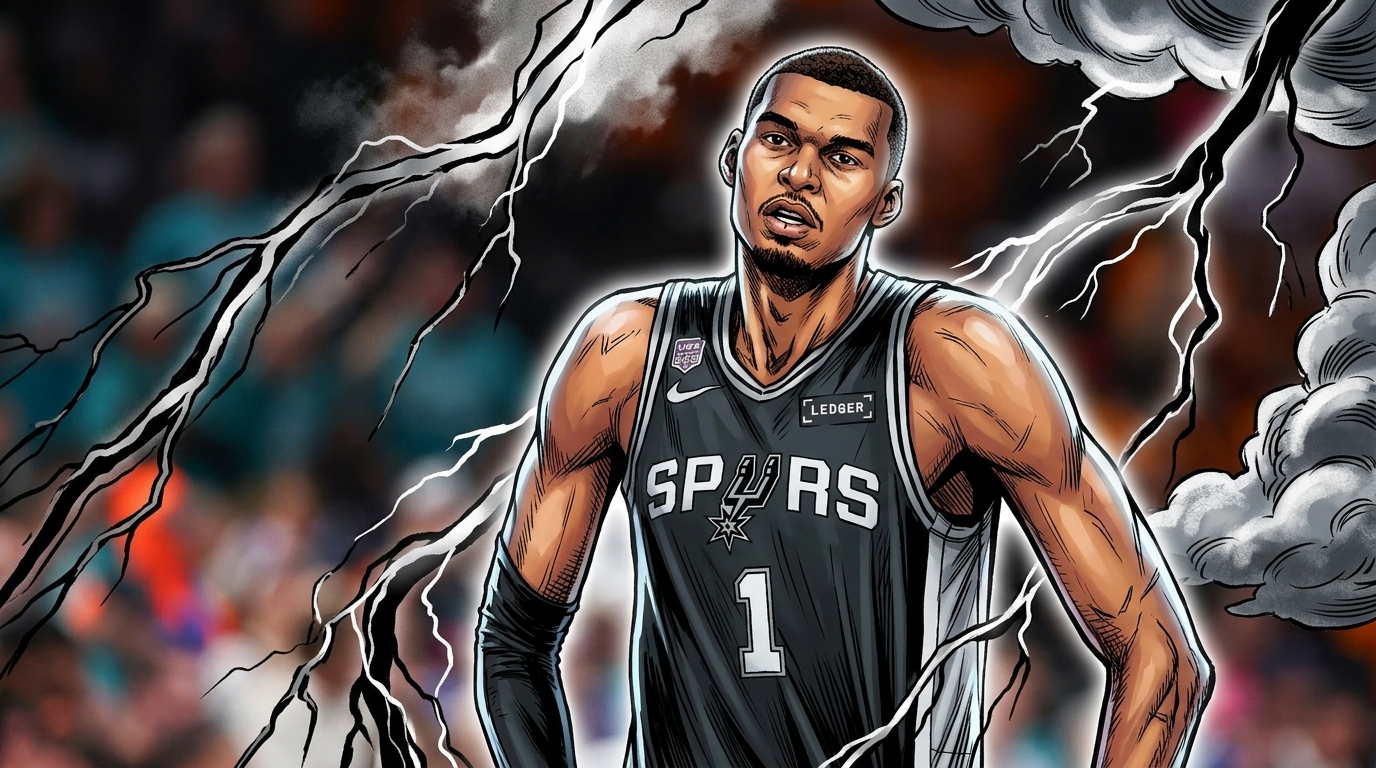
Can Victor Wembanyama Lead the Spurs Back From 0-2?
Wembanyama is averaging 27.5 PPG and 10.5 RPG through two Finals games, but the Spurs trail 2-0 and face 86.5% historical odds against a comeback: 32 of 37 teams that go up 2-0 in the NBA Finals win the title. New York’s defense is holding at a 103.5 defensive rating through two games, and with the best players in the NBA consistently struggling to crack that shell, individual heroics alone have not been sufficient.
The WCF Version vs. the Finals Version
The numbers from the Western Conference Finals against Oklahoma City are worth holding up next to the Finals numbers, because the gap is real and it is specific.
Against OKC, Wembanyama shot 48.1% from the field and 40% from three, per Basketball Reference, while posting 27.3 PPG, 10.9 RPG, 2.7 BPG, and 1.4 SPG over seven games. He was unanimous WCF MVP. He was playing at a level that justified every superlative written about him since he arrived in the league. Game 1 of that series: 41 points, 24 rebounds in double overtime. The box score looked like a video game difficulty glitch.
The Finals version is different. Game 1: 26 points on 6-of-21 shooting (28.6%), with 6 turnovers. Game 2: 29 points on 11-of-21 (52.4%), and the shooting line looked better, but 4 turnovers brought the two-game total to 10. That is 5 turnovers per game, more than his assists per game, and each one matters more against the Knicks because New York converts them efficiently in transition. The field goal percentage dropped from 48.1% in the WCF to 40.5% in the Finals. Not catastrophic on its own, but the turnover rate is the real story.
Woof. Ten turnovers in two Finals games, from the player who was supposed to be the answer.
The change in efficiency is not random variance. It has a cause.
What the Knicks Are Actually Doing to Wemby
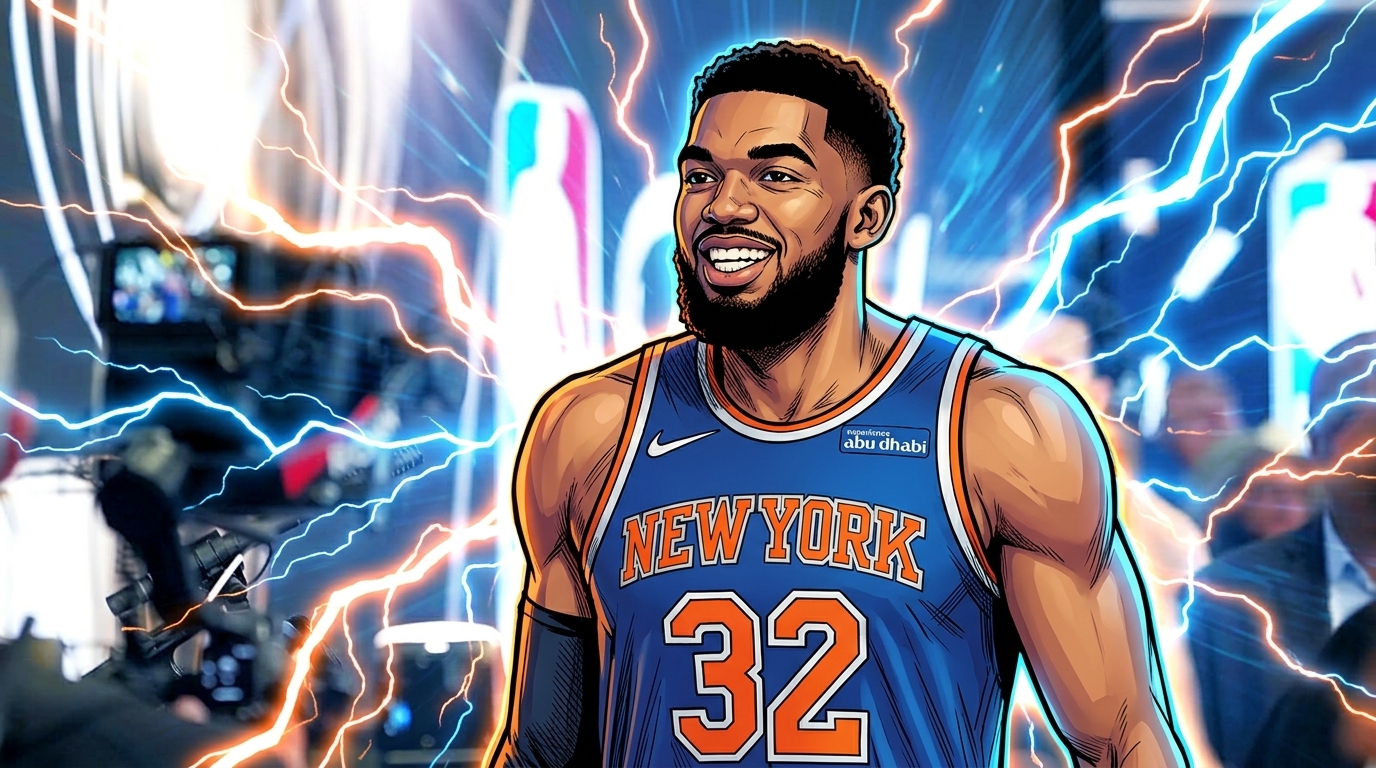
New York’s 103.5 defensive rating in this series is not accidental. It is the product of a specific scheme the Knicks have refined over the entire postseason. The core involves two things happening simultaneously: KAT dropping into a genuine post defender role on one end (which frees up defensive attention elsewhere), and New York’s guards crowding Wembanyama’s passing angles.
The 10 turnovers in two games trace almost entirely to that second piece. When Wembanyama catches on the perimeter or in the post, the Knicks rotate early and contest the pass, not the shot. They know he can shoot over anyone. He is 7-foot-4 and operates from any spot on the floor. What they cannot allow is him making the right read out of double-teams, because when he does, the Spurs offense runs smoothly. So they make the pass dangerous. They bump his passing windows. They station bodies in the lanes. And three times per game, on average, it works.
The Game 2 closing sequence is the most visible example. Wembanyama grabbed a rebound with 12.7 seconds left and the score tied at 104. He pushed the pace with a quick outlet. The pass hit Stephon Castle and bounced to Jalen Brunson, who walked to the free-throw line and made the first (105-104 lead) before missing the second with 9.5 seconds left — leaving Wembanyama a final possession that ended with a missed jumper as time expired. A sequence that began with Wembanyama gaining possession ended with him inadvertently handing New York the game. That is the Ceiling Compression Test working perfectly: his ceiling is high, his instincts are correct, and the Knicks still came up with the better outcome.
The Kobe-LeBron Comparison Nobody Wants to Hear
The NBA’s own social account put it plainly:
https://x.com/NBA/status/2062013907875618840
Kobe Bryant in 2001, LeBron James in 2007, Victor Wembanyama in 2026. The only three players this century to lead their teams in scoring entering the Finals at age 22 or younger. The comparison is legitimate, the data here is unambiguous, and the historical outcomes are the part the Spurs fanbase does not want to look at directly.
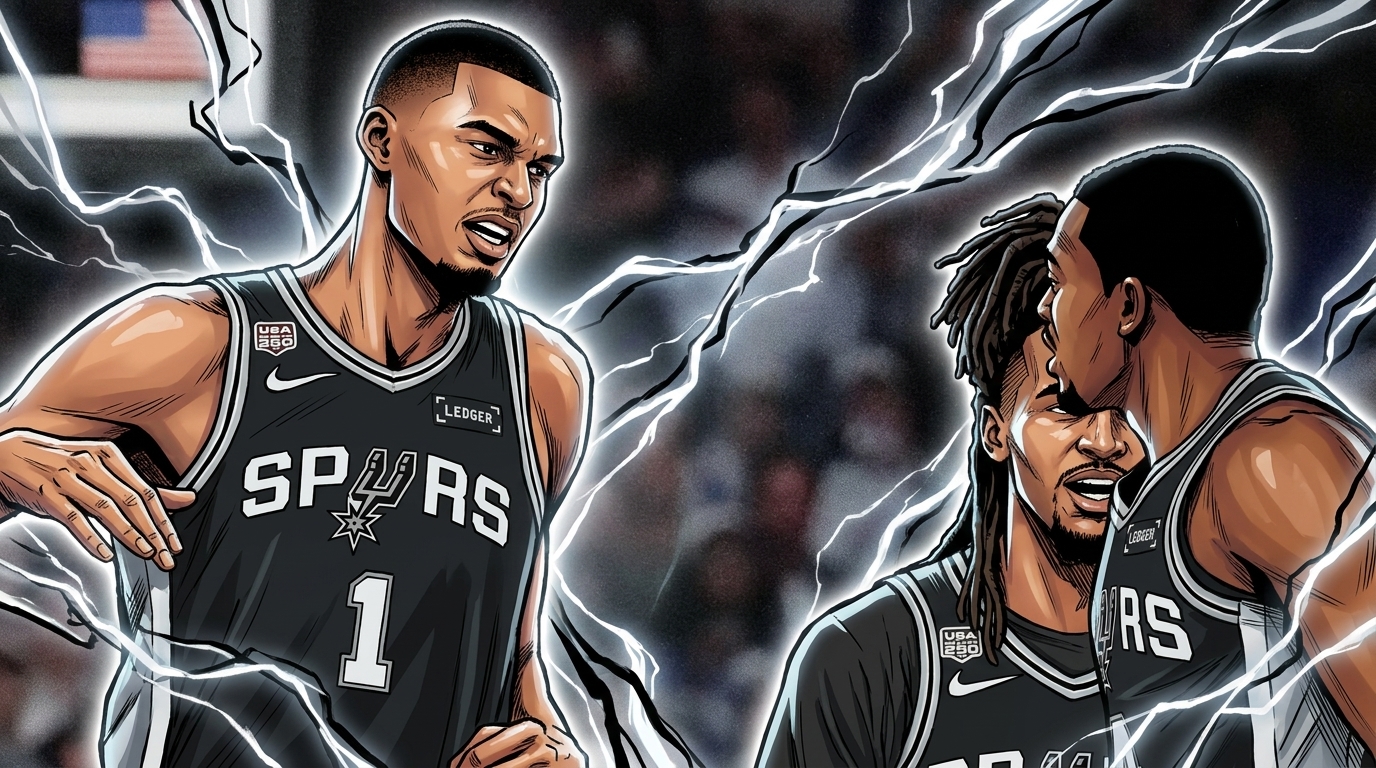
Kobe won. The 2001 Lakers went 15-1 in the playoffs, won the Finals 4-1 over Philadelphia, and Kobe was surrounded by a prime Shaquille O’Neal averaging 33.0 points and 15.8 rebounds in that series, per Basketball Reference. The player carrying the scoring load still had the best center in basketball making him functionally unkillable. LeBron in 2007 was 22, scoring at will, and got swept by Tim Duncan’s Spurs in four games. He was brilliant. He had almost no help.
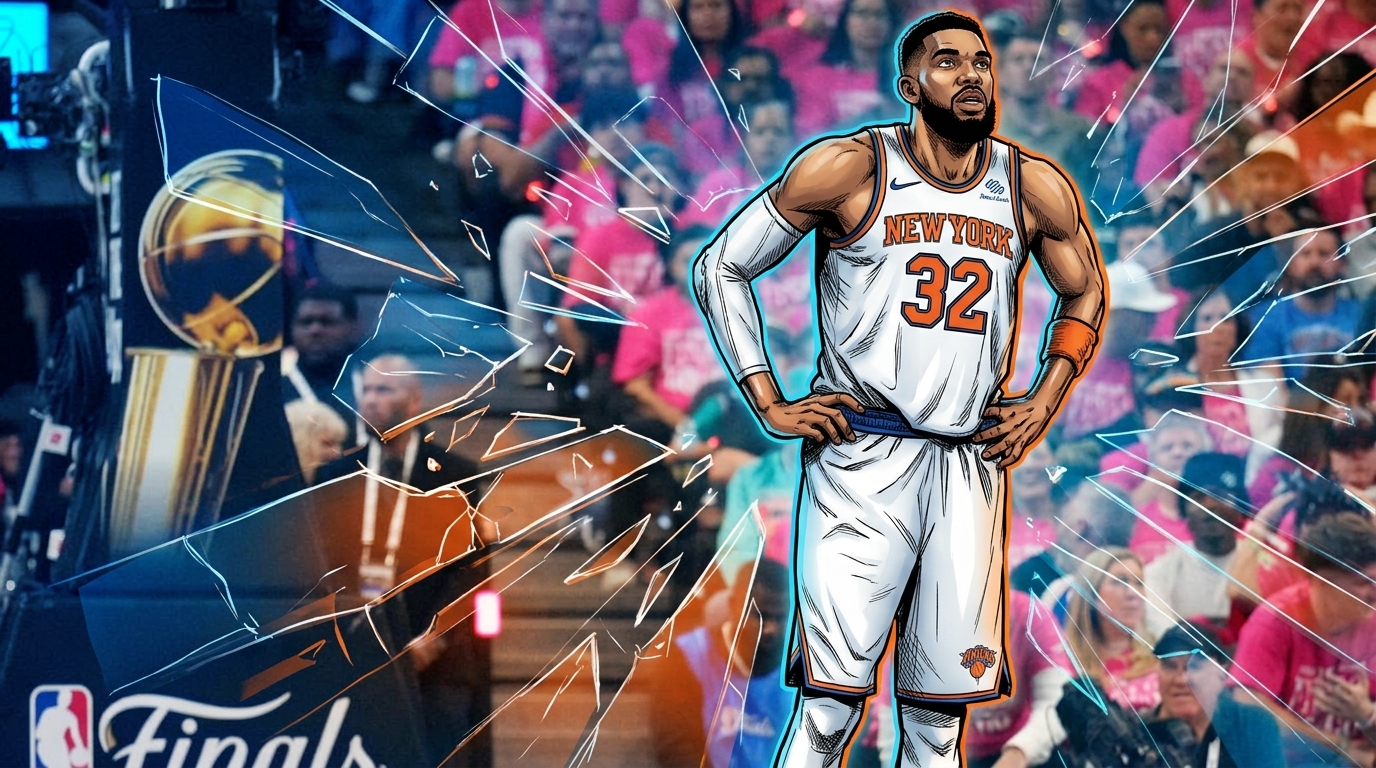
Wembanyama’s supporting cast sits closer to 2007 LeBron than 2001 Kobe. Dylan Harper scored 15 points in Game 2 (9 in the fourth quarter, which is a genuinely encouraging development), and the Spurs trailed by double digits in both games before fighting back to competitive territory. That comeback capacity tells you they are not a pushover. It does not tell you they can close against a Knicks team getting 19.5 PPG and 12.5 RPG from Karl-Anthony Towns, per NBA.com, and carrying Brunson as the player most likely to make the most important free throw in any given game.
I ran this three different ways and got the same answer: the historical comp that actually fits is closer to LeBron 2007 than Kobe 2001. That is not a character critique. It is a roster observation.
The Verdict
The evidence suggests Wembanyama will continue to produce at a high level in Games 3 and 4. He is 22, in his first Finals, and he has already shown he can score 29 on a 52.4% shooting night against a defense that has been the best unit in this postseason. The series shifting to Madison Square Garden for Games 3 and 4 is a more complicated picture. MSG in a Finals is an event — the first since 1999 — and the crowd will not be neutral. But the Spurs proved in Games 1 and 2 that they can fight back from double-digit deficits even on their own floor, and road environments have not historically stopped teams with the right player leading them.
What the data does not support is the idea that individual production alone flips a 2-0 deficit when 86.5% of teams in that position lose the series. The Knicks are the third team in Finals history to win two road games to open a series. The 1993 Bulls and 1995 Rockets are the predecessors, and both of those teams won championships. The pattern is not in San Antonio’s favor.
For the Spurs to win four games and become only the third team in Finals history to complete a comeback from 0-2, something specific has to change. Wembanyama has to cut turnovers from 5 per game to under 2. Harper has to sustain his Game 2 fourth-quarter output across full games. San Antonio needs an answer for Towns on the glass, where his 12.5 RPG average is tilting possession counts at a rate that compounds across 48 minutes.
None of that is impossible. The NBA Finals have produced stranger outcomes. Wembanyama’s postgame remarks about “acceptance” and “the journey” read as the kind of mental clarity that young players either grow into or get swallowed by, and he does not appear to be getting swallowed.
But the Ceiling Compression Test does not grade on potential. It grades on outcomes. Right now, New York is setting a ceiling on the Spurs’ offense that Wembanyama, at 27.5 points per game in the Victor Wembanyama NBA Finals 2026 series, has not found a way through. Until he does, the odds belong to the Knicks.